The GeekSeller Master Panel includes a data analytics dashboard. You can see your e-commerce business’ trends and generate different kinds of reports.
Limits and Exceptions:
- Walmart DSV sellers are paid based on their negotiated unit cost. Walmart doesn’t allow third parties to pull unit cost, so in order for our graphs to be accurate, the unit cost must be manually entered.
- If you view data for Walmart CA and Walmart US simultaneously, we add American and Canadian dollars without calculating the currency exchange. This will be addressed in an upcoming update.
- All calculations are in USD. If incoming data includes other currencies, it will be calculated without currency exchange.
- This dashboard only shows shipped/completed orders.
- Connecting marketplaces to GeekSeller does not automatically enable this feature. Our support team must enable it for you.
Dashboard Overview
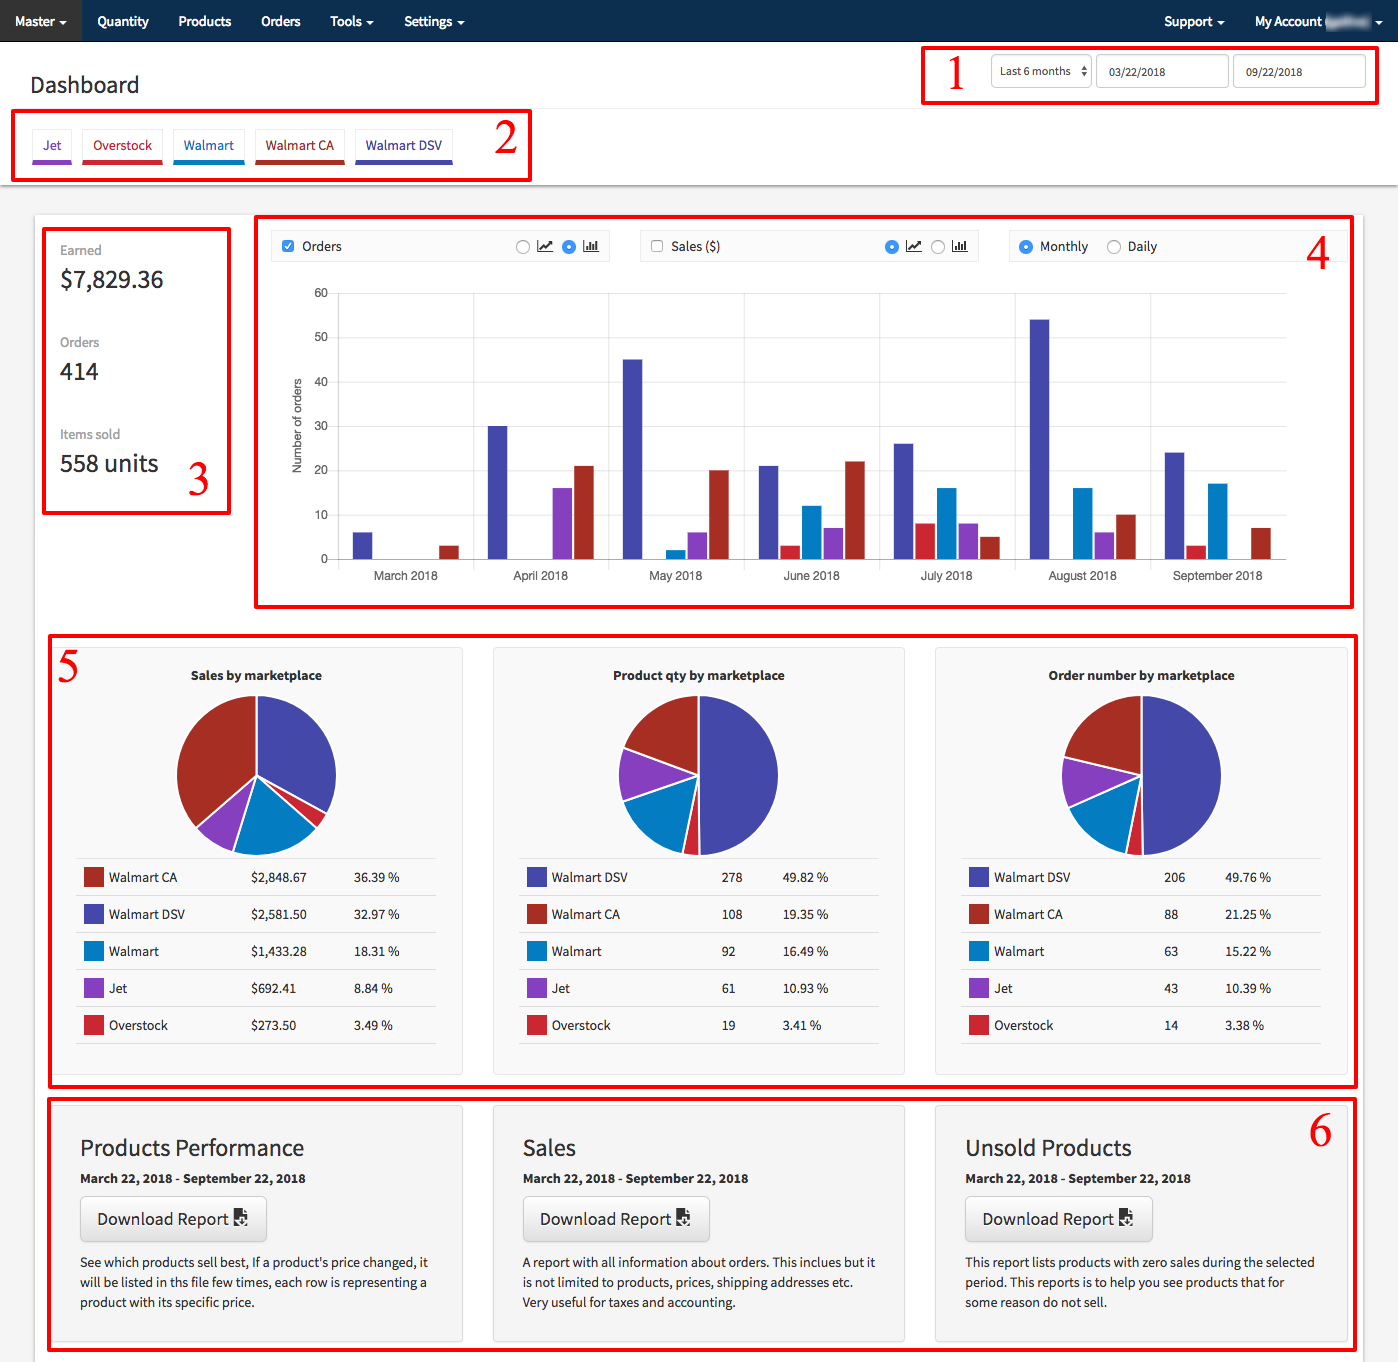
1. Select the Data Range
2. Filter by Marketplace
Filtering data by marketplace allows you to easily compare trends between channels. If any of your marketplaces are missing, contact our support to connect it.
3. General Statistics
To the left of the main graph, you can see the sum of values from the selected range and marketplaces.
The Earned value is calculated using the Total from the Orders page. This calculation is the unit cost adjusted for taxes, shipping costs, fees, and/or discounts (DSV Sellers, see here).
4. The Main Chart
This chart displays your order and sales data in a linear or bar style graph.
5. Pie Charts
Dynamically display your earnings, orders, and units sold as you select date ranges and marketplaces. Percentages displayed have a potential margin or error of up to 0.1%.
6. Reports
- Product Performance Report
This report contains product and sales information for the selected date rance. If you updated pricing within the specified timeframe, the units sold at the updated price will be listed as separate entries. Allowing you to see how many products were sold at each price. - Sales Report
This report contains a list of your orders from a given period of time for selected marketplaces. If an order contains multiple items, it will appear in this report with separate rows for each item containing the same order number, address, etc. - Unsold Products Report
if you select a range larger than 90 days you can generate a report which lists products that did not sell on any marketplace. This report lists products with a status Live / Published, that have been unsold during a given period of time.
Understanding Reports
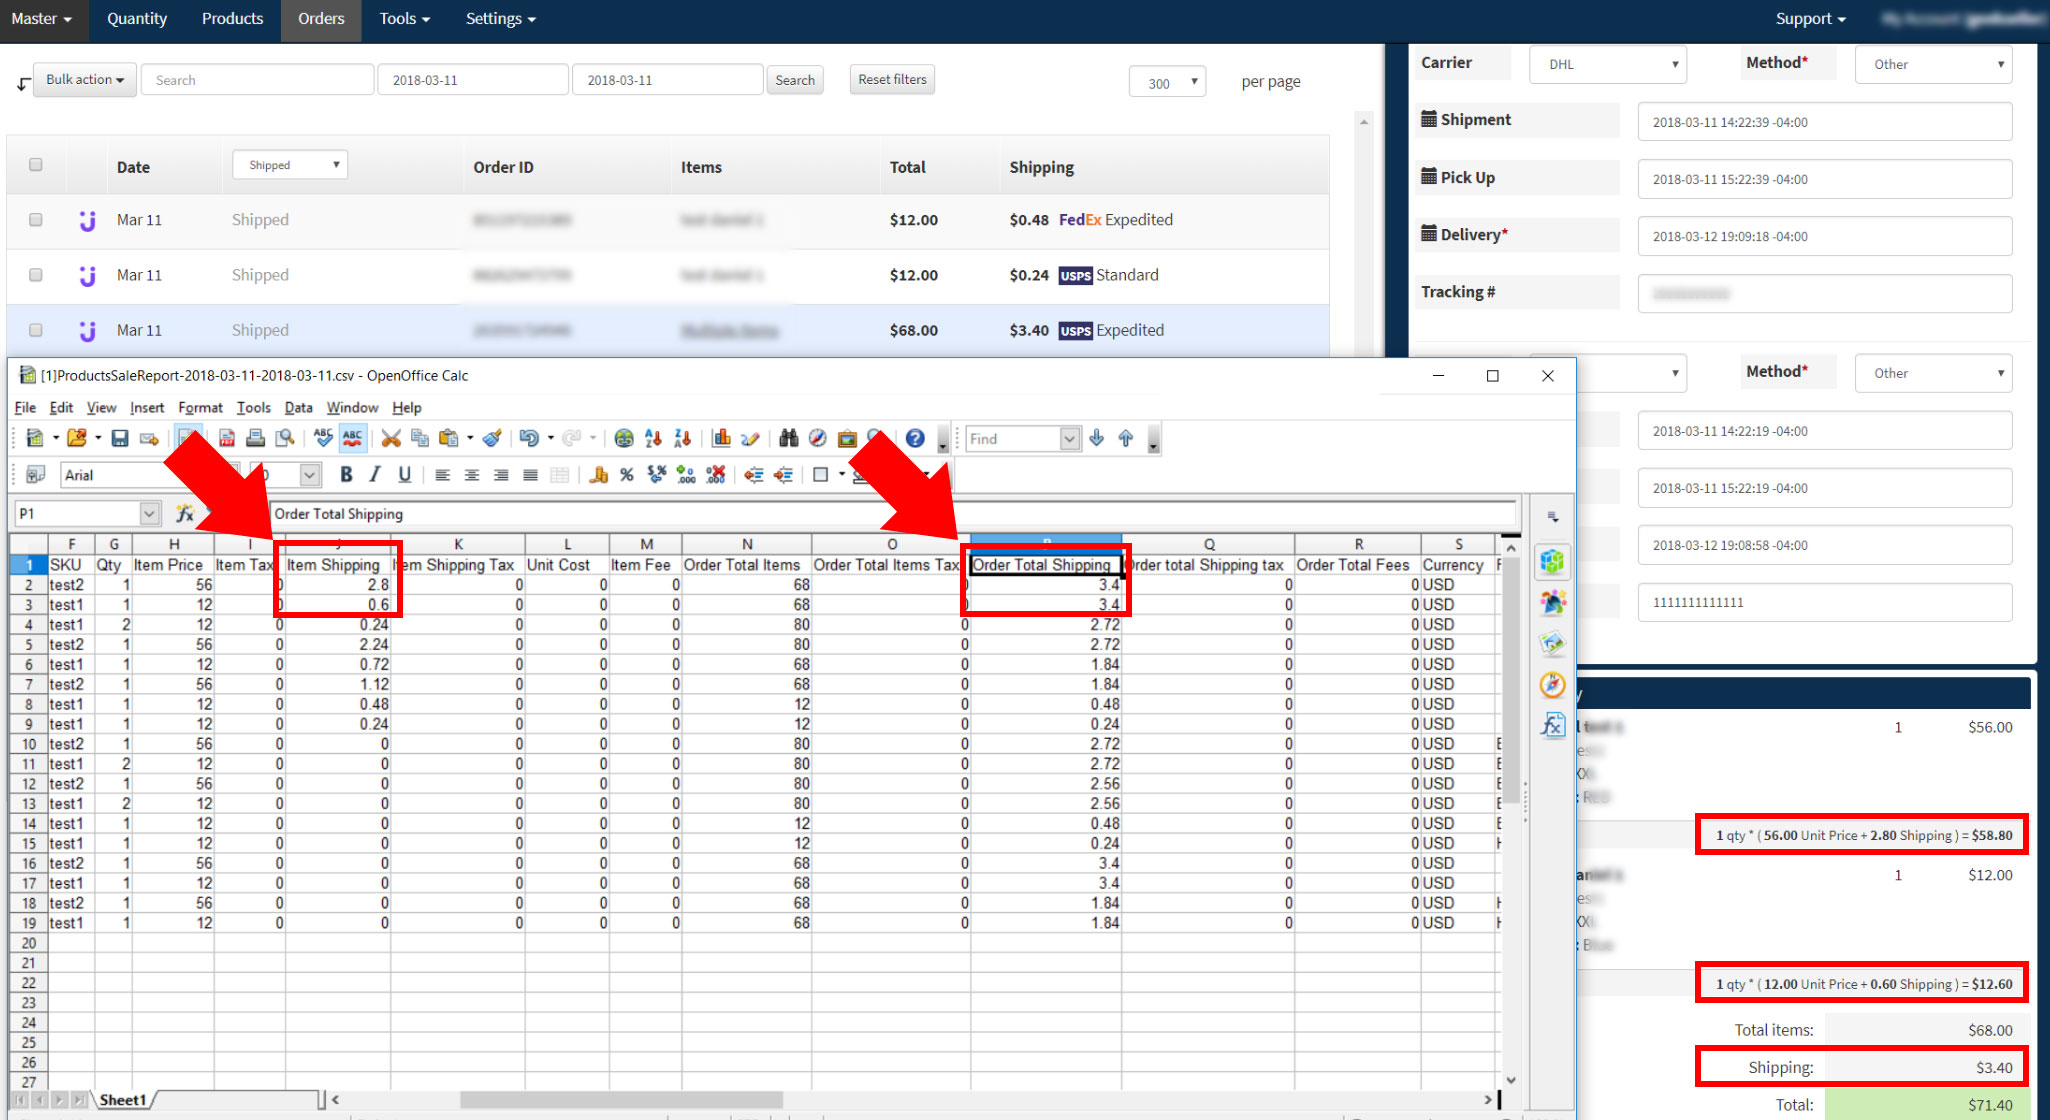
Each marketplace sends order information differently, which can have a major impact on how we read the data. Shipping cost is a great example. See below for a few different ways this data can appear in our reports.
Example One
Etsy provides the shipping cost as a value assigned to the entire order, not to an individual line item. Note that the “Item Shipping” value is $0.00, but “Order Total Shipping” is $3.99.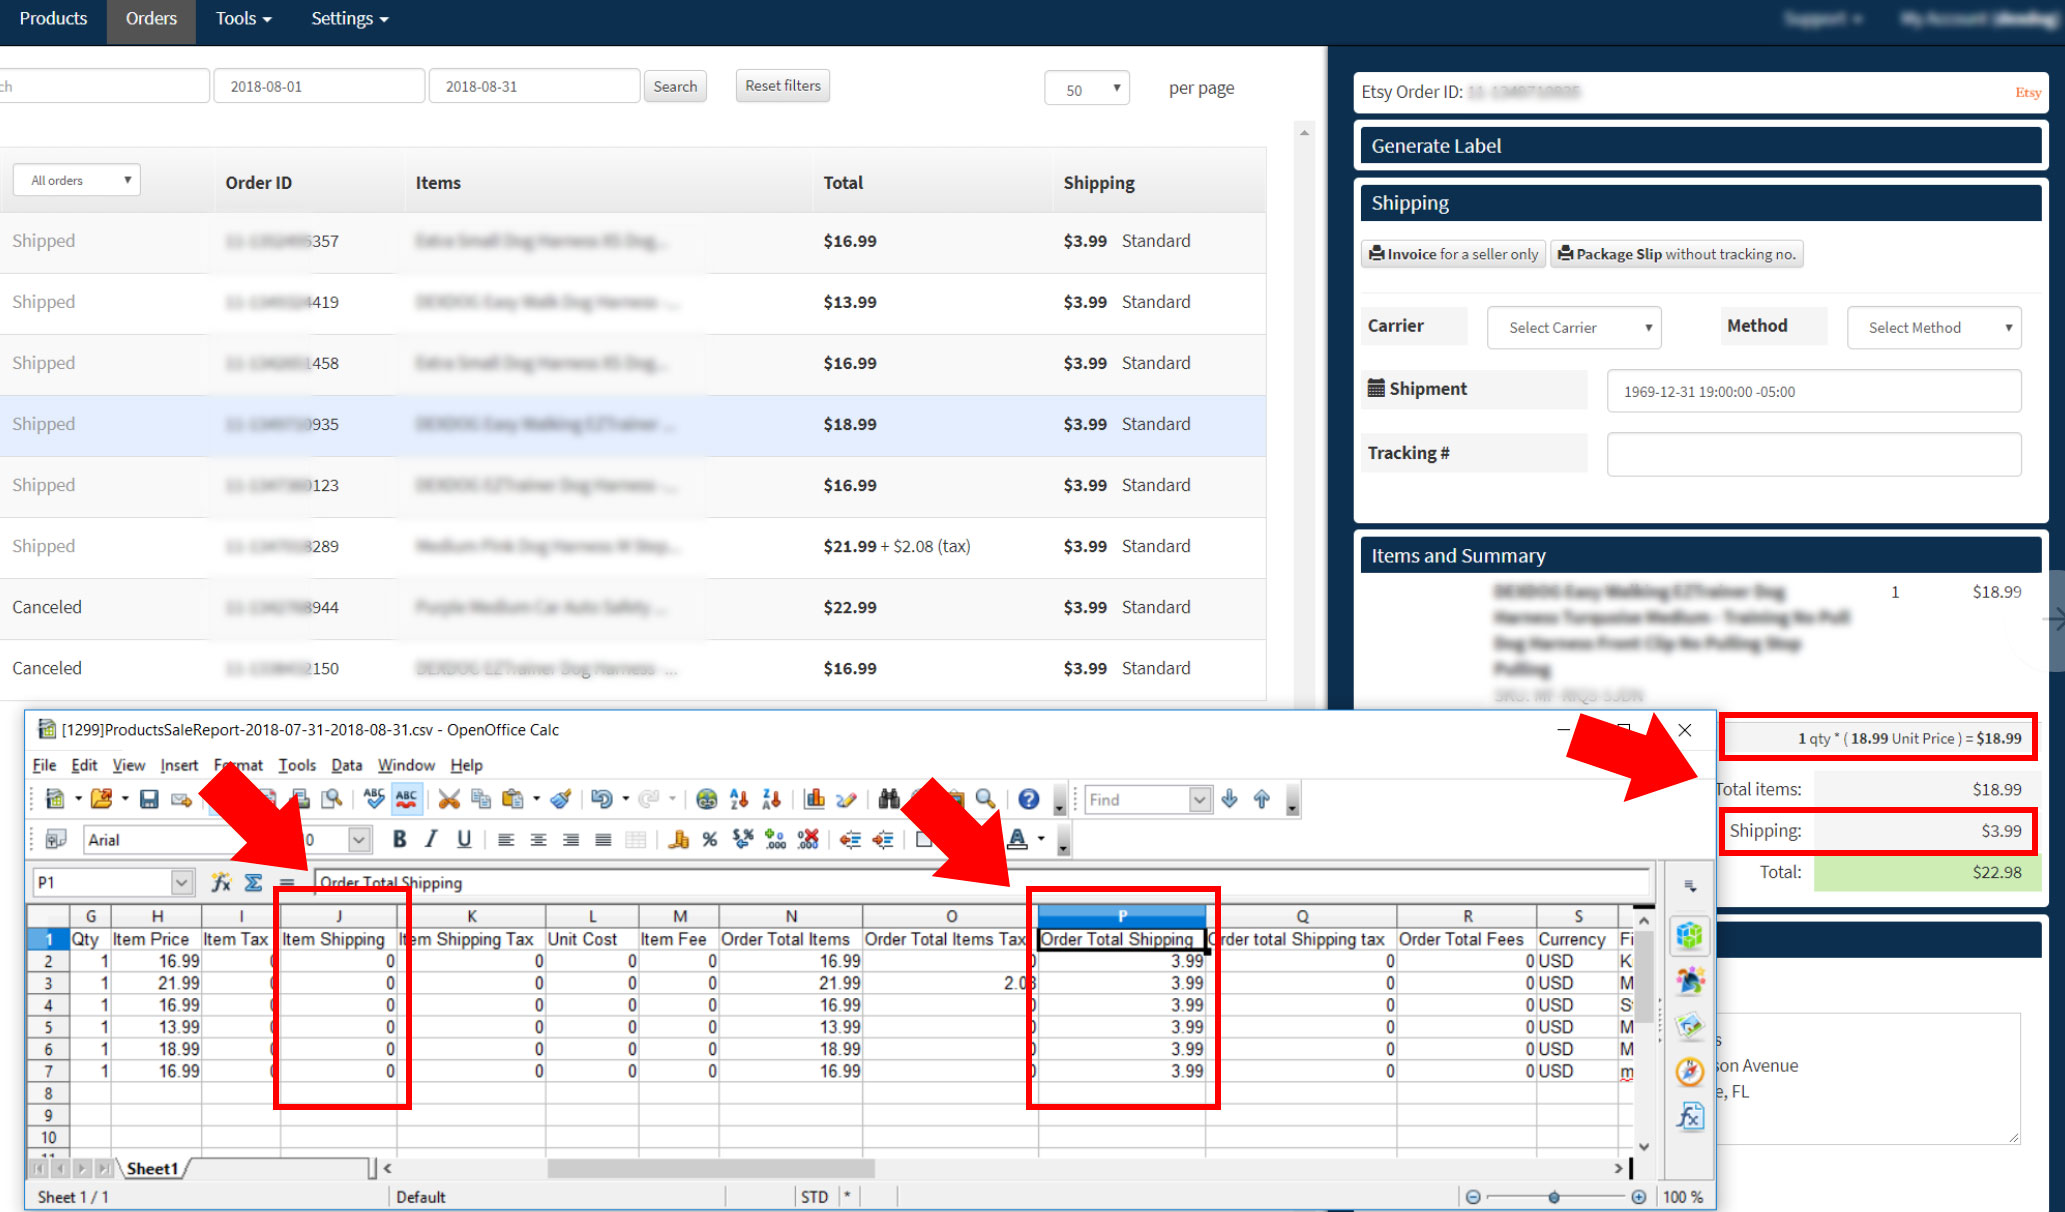
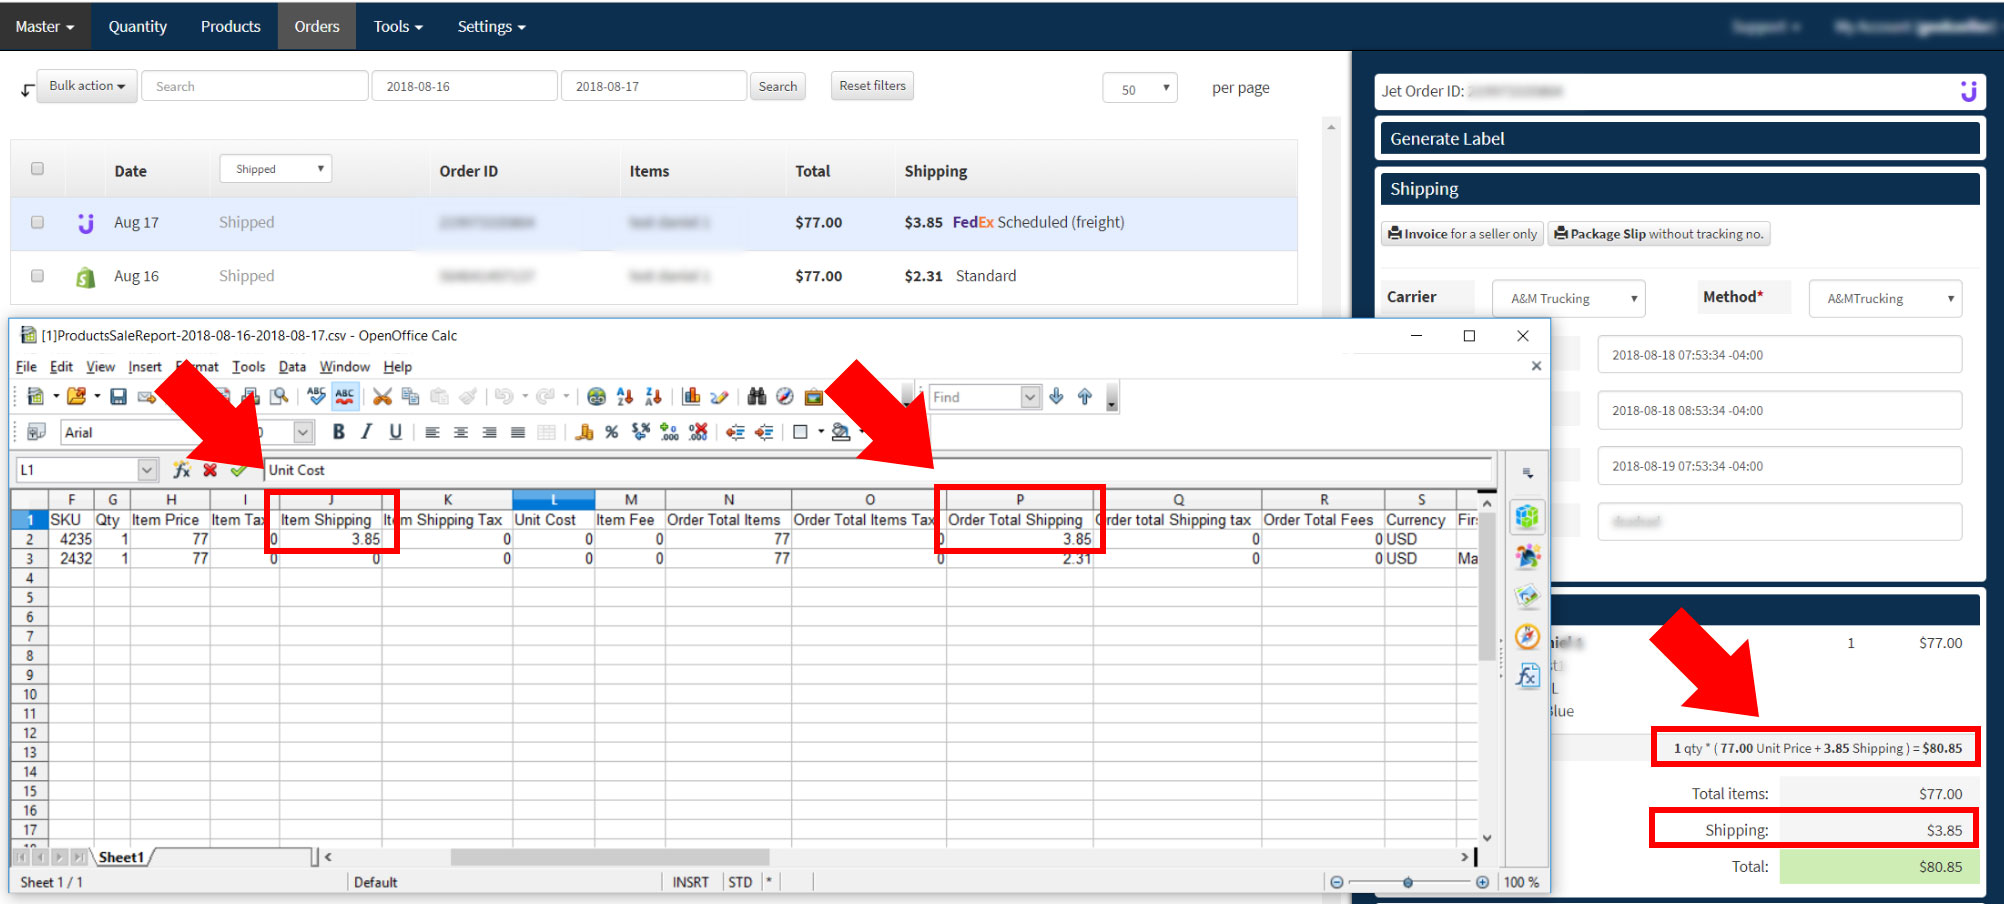
Example Two
Another marketplace may provide the shipping cost, in this case, $3.85, in both the “Item Shipping” and “Order Total Shipping” fields.
Example Three
Here we see an order with two line items. One item costs $2.80 to ship, the other costs $0.60, resulting in an “Order Total Shipping” value of $3.40, which is the sum of the two.